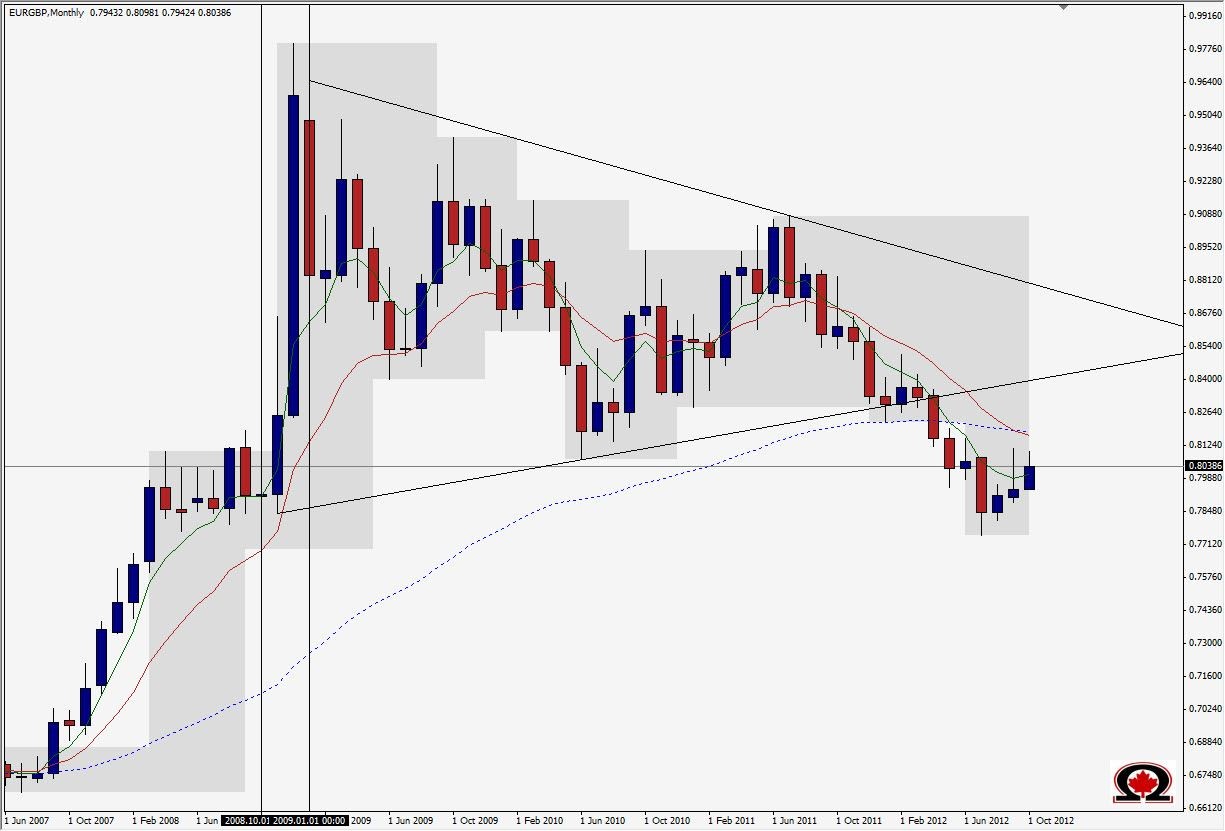
The EUR/GBP daily chart has been printing lower highs for what seems like ages, basically Bearish since hitting its all time high in 2008 at 0.9802. There have been Bullish rallies for sure as no chart ever goes only up or only down. This pair had formed a long term Pennant formation on the weekly charts which finally broke, in January of this year, but the bearish trend really wasn't confirmed until April when the pair finally broke below 0.8200. The interesting thing about this pennant formation in the Monthly Chart is that it was expected by many to break higher based on the pattern attributes of a strong Bullish run higher, followed by lower highs and higher lows. Typically, this is a pattern that will see prices continue in the original direction after a consolidation period. In this case, the pattern failed and prices have fallen as low as 0.7751 in recent months. Now, we see a similar pattern forming on the daily charts, although not as pronounced as the Monthly chart pattern.

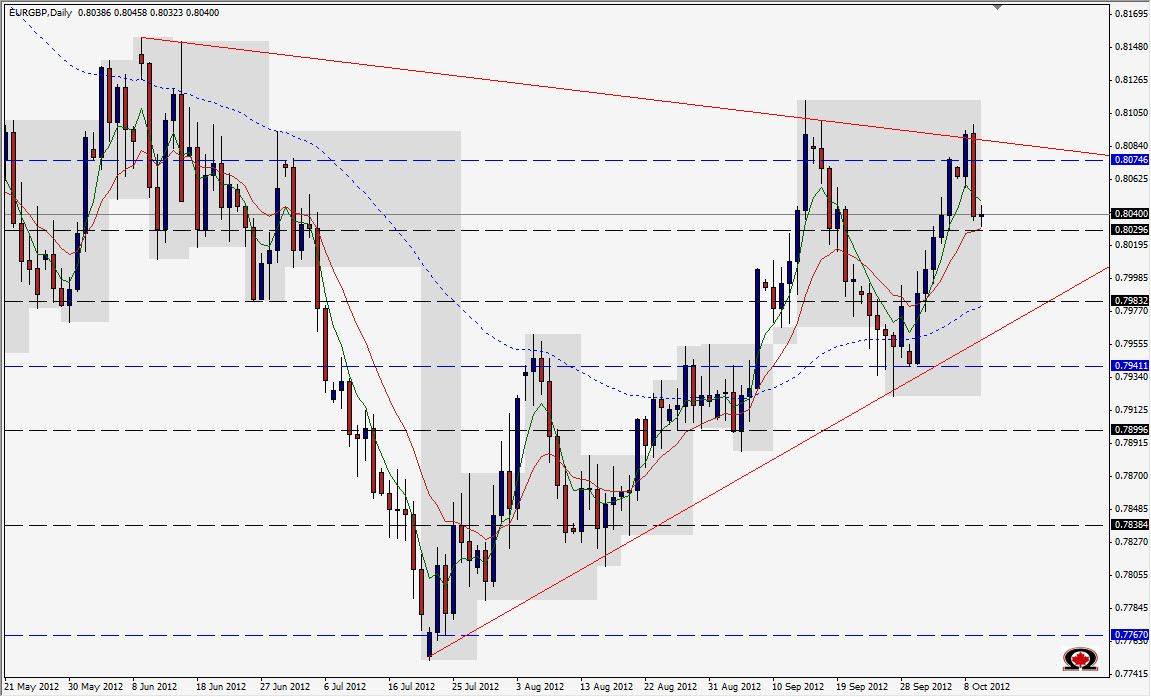
Yesterday price tapped the top of the descending trend-line and followed up by dropping from 0.8098 to 0.8036 by the end of the day, and completely engulfing the previous 3 days price action and suggesting a re-test of the lower trend-line is now likely. If 0.8030 breaks, especially with a close below this level on a Daily Chart, we should see a run down to 0.7950 with support along the way at 0.8030 (obviously), 0.7983 and 0.7962. If price can close below 0.7940 on a Daily chart, this will break the ascending trendline and probably result in a retest of the yearly lows around 0.7751. At this level, look for price to possibly form a double bottom and push back up to test the previous support zones.
Happy Trading!

