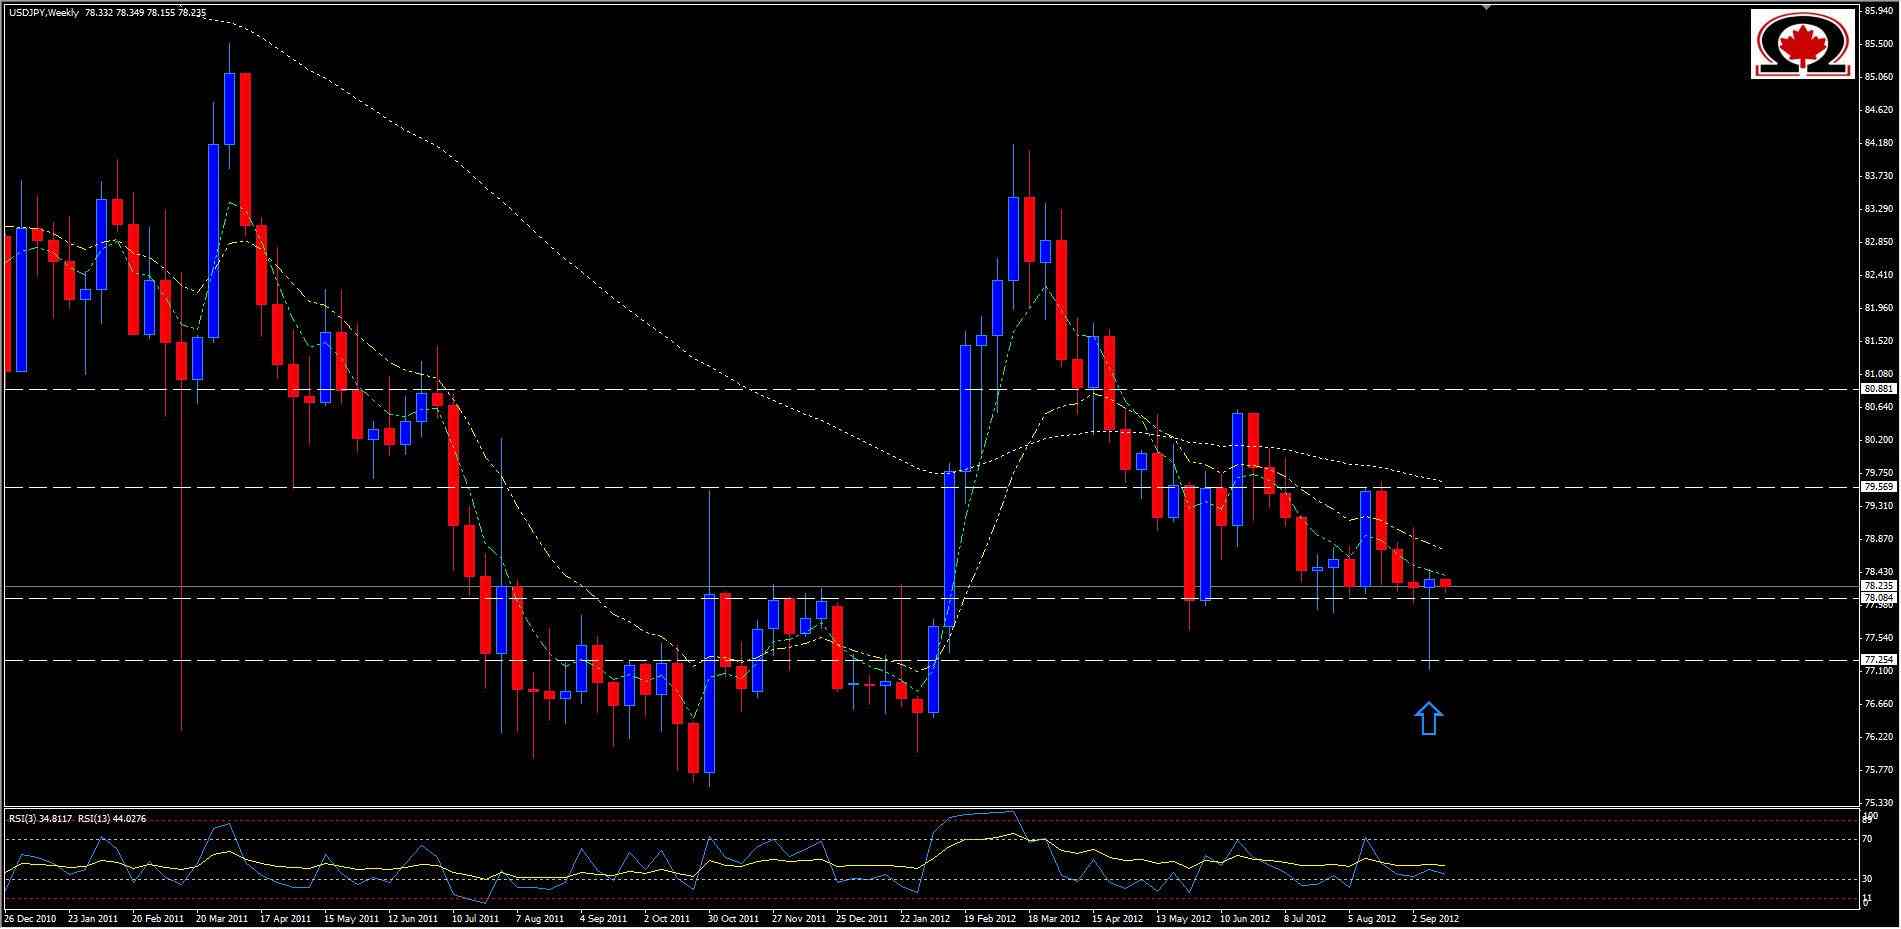
The USD/JPY is a pair trapped by its own price action. 2012 has seen the pair trading for the most part, in roughly an 800 pip zone between the January 29 low at 76.016 and the March high of 84.170 with the 78.00 area being very strong support and the 79.50 level being the strongest Resistance overall. Essentially trapping the pair in an even narrower range of about 150 pips for most of the year so far.
Last week we saw the pair finally break the 78.00 level and trade as low as 77.128, but the pair once again rejected the 77.00 level and returned to close the week above the 78.00 Support Level at 78.331. This has resulted in a Weekly Pin Bar, an indication that price is potentially setting itself up to move higher (in this case). Now the question is, can the pair break the first Resistance level if significance at 0.78.629? Even if the pair can break through, there are 2 more major resistance areas waiting including the Weekly R1 at 78.82, a level that many daily candles have closed, and beyond that the Weekly R2/Monthly R1 at 79.313-79.359.
For the most part the trend for the year, if you can call it that, is bearish. There have been Bullish spikes here and there, as well as some bearish ones, but if the pair isn't going sideways it seems to have more downward momentum than up. So what does this mean to those trading it? Well, one scenario is that we see the pair push above 78.60 and begin a more Bullish period with the years high as a target, or we see price do what is sometimes called 'fading the tail' and move lower to take a run at setting a new low. As tempting as it is to take a long position on this pair based on the candle pattern, so much congestion, or 'traffic' to the left makes it a rather risky gamble. I will wait for the pair to either set a new yearly low before jumping on the bandwagon, or close above 81.00, where there is less resistance to impede momentum. I am neutral on this pair for now.
Happy Trading!

