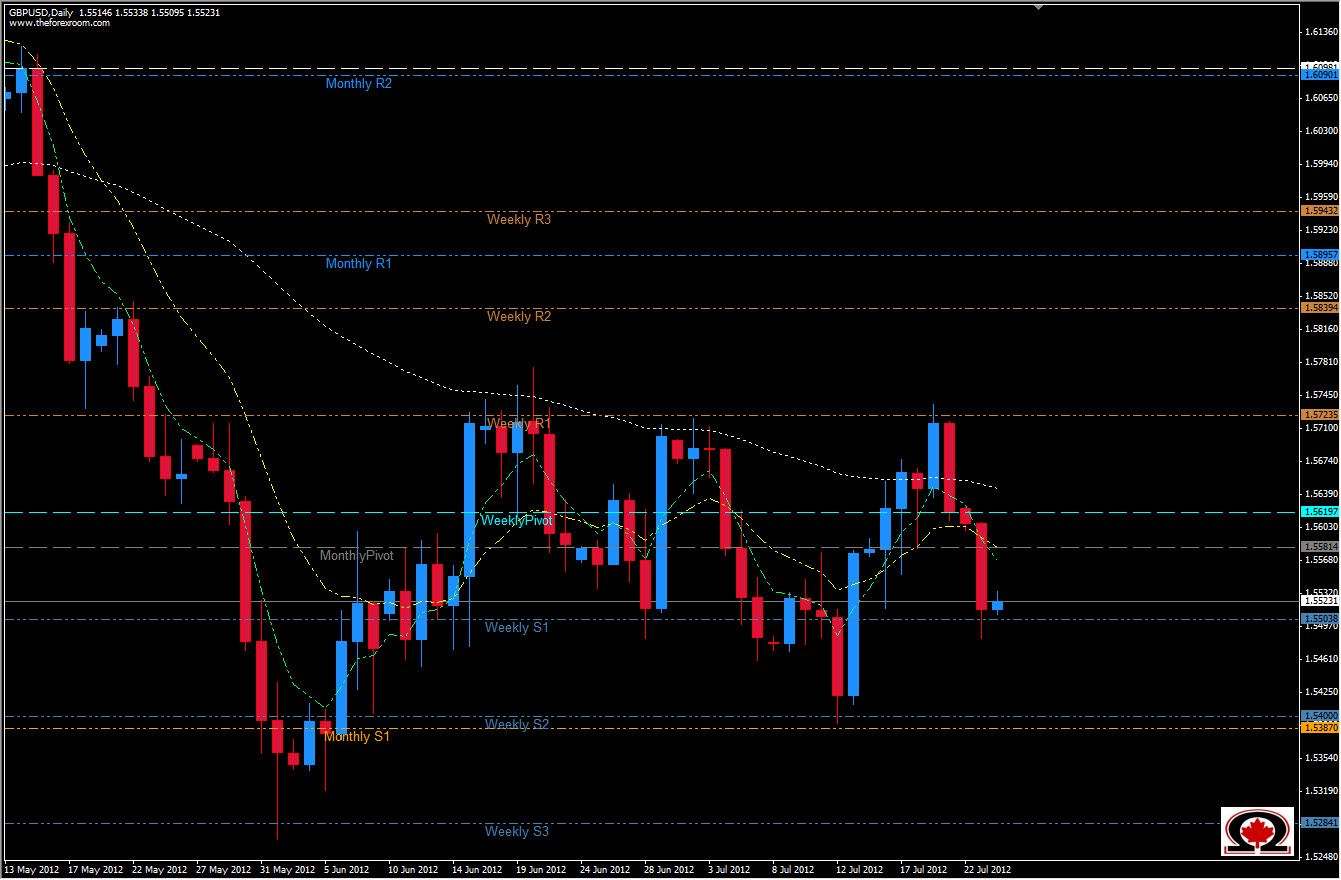
The GBP/USD has been trading in a range of about 350 +/- pips since early July and now appears to be getting ready to test the lower end of this range once again, with yesterday's candle being strongly Bearish and initiating a Bearish cross of the 5 & 13 EMA's. The descent of the pair stalled at the Weekly S1/1.5500 which is also a strong psychological barrier for traders and my cause the pair to retrace somewhat, or even reverse, but if price breaks below the low at 1.5484 it is highly probable that price will trade down to 1.5400, which is both the Weekly S2 and the Monthly S1, a VERY strong level of support. Last week when price touched this level it reacted with the Bulls taking over for 4 out of 5 trading days and might cause the same reaction this time. It is quite possible that a double bottom will form at 1.5400 and the Bulls will be back in control, but if 1.5400 is breached we will be looking for a re-test of May's low at 1.5267. If price does not clear 1.5400 and turns Bullish immediately, look for resistance levels at 1.5580 which is the Monthly Pivot as well as 1.5620 and the previous series of highs at around 1.5730. The GBP/USD does trend as well as some of the other pairs bu rather tends to make a big move one way or the other, and then take back, or extend price in 'steps'. So if looking to go short or long on the GBP/USD, take profits often at key levels...and get used to trading within chanels because this is a strong trait in this pair, at least from this Daily chartist's perspective.

